Report Builder
The Jetpack report builder is where you get report data for campaigns on your account.
When you login you can access the Report Builder by clicking REPORTS on the left hand navigation column.

Report Builder Interface
Generating A Report
Report Type:
- Engagement Report - calculated columns get added and show the calculated engagement rate (these included fields can be modified using the column editor feature)
- Raw Data - shows all data that was tracked on the campaign, including video quartile data listed by file name, and much more
Order Name: Type to complete box.
- Choose Order Name: The Order is the title of the campaign. It should be straight forward in the titling using the campaign name and website
- Generate All Orders: You also have the option of pulling all reports at once. This is a good feature to use for end of the month or end of the year reporting needs. For this you would select Order “All Orders”. This will export the reports on separate excel pages. We would want to make sure that all the engagement settings are set up.
Threshold: The threshold limits the returned results. So if you set it to 100, no line item will show that has views under 100.
Start Date / End Date. If you do not enter any dates the report will just pull all the data. Note: We did just update our system so that it can pull records on the hour. Previously it was a day behind.
Time Frame: You can choose Month, Day or All Time. Generally I will send Daily metrics unless requested otherwise.
Level:
- Line Item: It displays the metrics by line item (Placements) and then lists the time frame selected.
- Date: Very similar to line item: Show data by placement and then lists the time frame selected.
- Creative Set: This would break out the unit by device if the campaign had mobile/tablet/desktop creative.
- Custom Unit: Displays the creative by unit; This particular campaign was all video walls, but if it had other units it would list them here.
Click Build Report Generates the data.
Click Export XLS when ready to download Excel File of all formatted data.
Settings
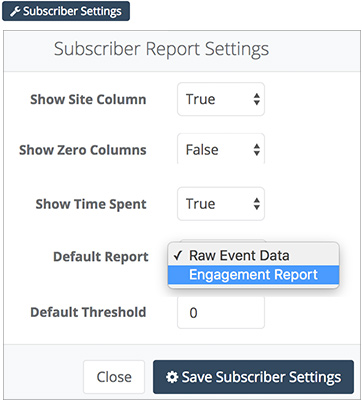
On the top of the interface, this button will set your preferences for how reports look by default and what information is included in your Subscriber's default report. Please contact Jetpack if there is anything else that you would like to see set as preference that is not included.

Option | Details |
|---|---|
Show Site Column | Shows the site from the line item setup, use this if you are running across multiple sites and have each line items setup for a different site. |
Show Zero Columns | Shows columns that have no report data, use this to keep your default engagement report columns the same on all your reports |
Show Time Spent | Shows Total Seconds spent w/ the ad unit 50%+ visible on page, and an average time, calculated as (TOTAL TIME (secs) / IMPRESSIONS) = AVG TIME SPENT (secs) |
Default Report | Choose your default report format, if you hae a custom report from Jetpack you would select it here, otherwise the options are ENGAGEMENT and RAW DATA |
Default Threshold | When generating a report, any line item with a value less than the Default Threshold setting will not appear. TIP: Very useful when running "ALL REPORT DATA" to weed out the orders with less than 1000 impressions. |
Report Columns and Engagement Rate.

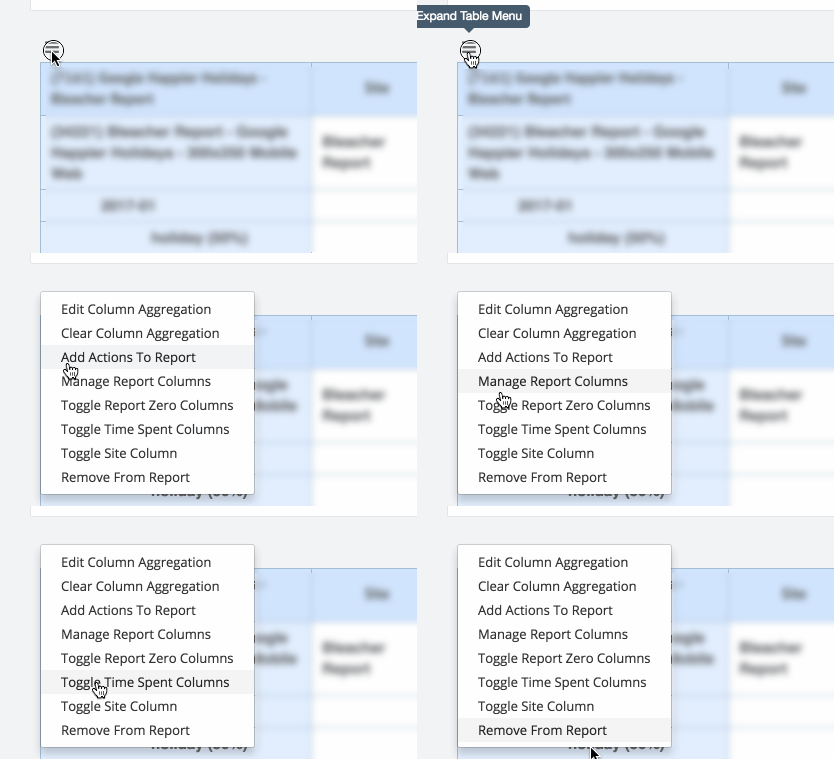
Click icon on left hand corner of the report.
Any changes made only apply to the specific Order in this report. And changes will persist the next time you load this order's report.
Options in Table Menu | Details |
|---|---|
Edit Column Aggregation | View aggregated column details |
Clear Column Aggregation | Remove any customizations that you may have added, reset the ER%. |
Add Actions to Report | Add columns to the report, use this to add specific report data columns that you might want to point out. |
Manage Report Columns | Hide specific columns from this specific report. |
Toggle Report Zero Columns | Hide any zero columns from this report. |
Toggle Time Spent Columns | Turns off the Time Spent and Average Time Spent report. |
Toggle Site Column | Hides site column from this specific report. |
Remove from Report | When you have built multiple reports using the report builder interface you can remove a single report from the list. |
Edit Column Aggregation
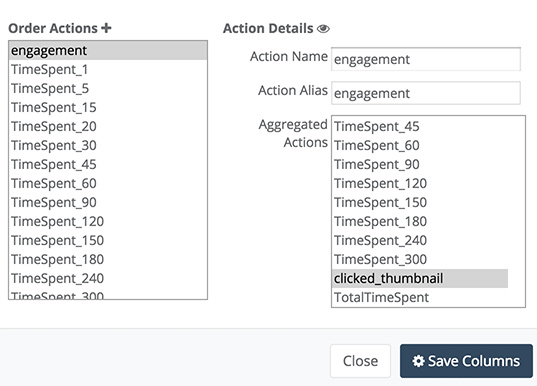
Click “engagement”; This will pull up all the actions included in the Engagement metrics. Clicks and other positive engagement like clicking to play video or clicking through gallery elements would be selected here.

Updated 10 months ago
